Player rankings can seem mysterious at times. Auction values, even more so. How do your favorite fantasy baseball sites come up with these things? From ESPN to Yahoo to CBS, it’s tempting to think they’re totally arbitrary, just players and numbers thrown on a board at the author’s whim (some of them certainly are… I won’t name names, but yikes). As it turns out, there are actually several player valuation systems that are commonly used to come up with player rank – these calculations, combined with your projection system of choice, allow you to directly calculate player values and rankings!
This is the best way to value players. It forces you to decide what you realistically project a player for. You want to move a player up your board? Fine. But you should do it by adjusting a projection, not by arbitrarily deciding A is better than B because reasons. Decide how realistic you really think it is that Giancarlo Stanton is going to play 162 games and hit 50 yaks (you think he is? ok.gif), and adjust accordingly. And when you find yourself playing in your cousin’s 10×10 league with all sorts of wacky categories, you pretty much have to rely on the projections to tell you what to do, since the typical 5×5 wisdom is totally out the window.
I throw around the terms “z-score”, “SGP”, and “Points” fairly liberally here on the Harper Wallbanger blog. Fantasy baseball loves its jargon. All of these terms describe systems used to assign player values when generating rankings or auction prices. But if you’re not a hardcore spreadsheet wizard, you might be wondering what the differences actually are in how these are calculated. Especially given that the Big Board allows you to choose any of the three systems, it’s time to bring some clarity to this situation!
A technical note before we start: the “BIGz” score used in the Big Board was originally just a z-score, hence the “z”. These days, it’s a catch-all term used for any of the $ values generated by the sheet, no matter the valuation system used.
There are four basic steps to the creation of BIGz $ values for players from raw projections that I’ll step through and explain:
(1) Initial calculations (different for each system)
(2) Modifications (h/p split, aging, bonus PT)
(3) Replacement levels (positional adjustments)
(4) Dollar conversion
1) Initial Calculations
z-Scores
z-Score: a statistical measurement of a score’s relationship to the mean in a group of scores. A z-score can be positive or negative, indicating whether it is above or below the mean and by how many standard deviations. A z-score of 0 means the score is the same as the mean, while a z-score of 1 means the score is exactly 1 standard deviation above the mean.
z-Scores are probably the most popular system for creating player rankings and dollar values, thanks to their relative simplicity. I originally encountered them in the form of ‘FVARz’ (Fantasy Value Above Replacement z-scores) as popularized by Zach Sanders (formerly) of Fangraphs. The first step of creating player values in this system is to calculate and sum the z-scores for every player. To do that, you need to know the average and standard deviation of every given stat used in your league. I use the past three years (2017-2019) of collected stat lines from all qualified players to do this. Here are some of the values currently used in the Big Board:
![zSxXXlR[1].png](https://images.squarespace-cdn.com/content/v1/58767fbe5016e1b7342a92fa/1580196522789-3L6HBGO3F6UKFMU5FRPQ/zSxXXlR%5B1%5D.png)
I then calculate the ‘above-average’ score for every player, which I call BIGAA in the Big Board (I also convert mine to an auction dollars scale), by summing the z-scores for each category. For instance, a player projected for 25 HR has a z-score of (25-20.6)/9.8, where the average # of HR’s is 20.6 and the standard deviation is 9.8, giving us a z-score of 0.45. Note that it’s important to keep your AVG and STDEV values up to date – in a previous iteration of this blog post, a mere 20 HR was worth a similar z-score of 0.47 – the relative value of HR’s has changed a lot in a couple of years!
We also have to take another step for anything that is a rate stat. To illustrate why, consider the fact that a pitcher that throws 1 inning with a 0 ERA/0 WHIP is actually less valuable than a pitcher that throws 200 innings with a 3.00 ERA/1.00 WHIP despite having better rate stats. We’ll define what I call a number-weighted z-score (subscripted ‘n’ for short), in which the first z-score is multiplied by either PA, AB, or IP (depending on what the rate is measured over), then re-z-scored vs. the AVG and STDEV of the historical number-weighted z-scores.

Standings Gained Points (“SGP”)
We’ll forego the italic dictionary definition for this one. Standings Gained Points are very intuitive if you’ve ever played in a roto league, and they do exactly what they say – for each category, you decide what marginal value of that category is necessary to move up one point in the standings and gain a point. This system has been popularized and used in enough circles that I’m unsure of the origin, but for the uninitiated I will direct you towards the excellent work of Tanner Bell at SmartFantasyBaseball and at FanGraphs. I find that outside of the more peculiar leagues, SGP and z-scores will actually give very similar player valuations most of the time.
In certain contexts, SGP is the perfect system, because you can tailor it precisely to the real values placed on the various categories in your league. Your leaguemates might chase HR and forego SB every year, and you’ll be able to account for that behavior. However, it also means that you need to have good intel on your league – if it’s your first year in the league, or if there are lots of new owners, or new rule changes, then you’re SoL! The Big Board comes pre-loaded with SGP values for fairly typical 5×5 leagues:
![Pa7fMxa[1].png](https://images.squarespace-cdn.com/content/v1/58767fbe5016e1b7342a92fa/1580197349657-V3EZWPPDCPTC1XRB0RN3/Pa7fMxa%5B1%5D.png)
![B0FOSpq[2].png](https://images.squarespace-cdn.com/content/v1/58767fbe5016e1b7342a92fa/1580197416060-BN27T6P9B9O3WEQG8UUP/B0FOSpq%5B2%5D.png)
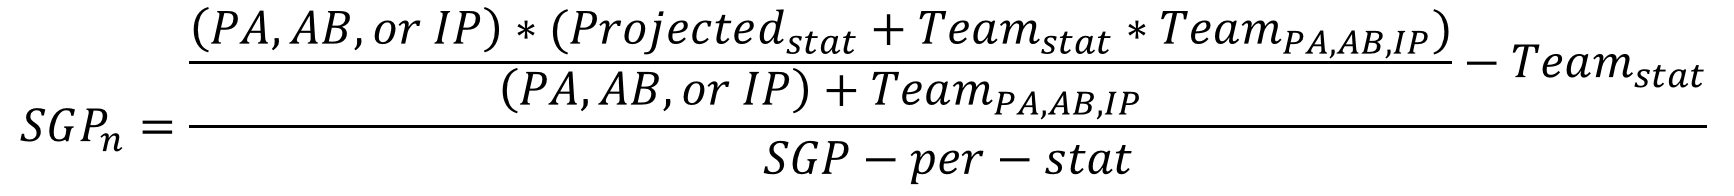
Like before, the next step is calculating the ‘above-average’ score for every player, by summing the SGPs for each category. For instance, a player projected for 25 HR has 25/12.0 = 2.08 SGPs in the HR category. Also like before, rate stats are more complicated. The approach is a bit different. Now what we’ll do is calculate your team’s overall performance in a rate stat with the given player included, then subtract the rest of the team’s performance to find the marginal difference, finally divided that value by the SGP-gained-per-stat to arrive at our SGP. That confusing explanation culminates in the confusing equation shown below, but again I will direct you to Tanner Bell’s excellent explanations here.
Points
Points are easy! Why is there even a section about points? Well, put simply, the base level calculations for points are what you would expect. Your league rules dictate each counting category is worth some number of points. Multiply each player’s projections according to the points values and you’ll arrive at a point total. Note that the way that points leagues calculations work means that playing time is VERY important! If you spend time doing one thing prepping for a points league draft, try to figure out how playing time will be distributed amongst your starters and reserve players, what the waiver wire will be like in the league, and whether you’ll be able to stash DL guys, and adjust your projections accordingly!
2) Modifications
Having calculated the raw BIGAA score for each system, things now start to get more complicated as we fine tune the values by applying a hitter/pitcher split, aging modifications, and playing time bonuses.
-
H/P Split – As explained elsewhere on this site, the hit/pitch split is used to set the overall value of hitters vs. pitchers. This modification is applied as a multiplier to all pitchers until the ratio of overall hitter-to-pitcher value matches the desired ratio.
-
Aging – The aging curve modifications are derived from the methodology introduced here a few years ago.
-
PT Bonus – The playing time bonus allows us to account for part-time players by assuming we will fill their spot with waiver/bench-player production on days they don’t play. In other words, its most useful for daily lineup, daily moves leagues. How to calculate the per-PA and per-IP bonuses is perhaps a discussion for another day, but the Big Board does it for you! So far, here’s what we have:
![ARdSFzd[1].jpg](https://images.squarespace-cdn.com/content/v1/58767fbe5016e1b7342a92fa/1485679193868-WD39IHQ4ZILPE9XOJ5Q8/ARdSFzd%5B1%5D.jpg)
3) Replacement levels
So we’ve arrived at BIGAA scores for all three systems. It’s good enough to a first approximation, but now we need to account for position. It’s fairly well known that you just can’t expect catchers and middle infielders* to put up the same level of fantasy productivity as corner infielders and outfielders (although these days, the gap is closing for everyone except Catchers). To account for that, we’ll figure out how many players are rostered at each position, and then set each players value equal to how much better their BIGAA score is than the first unrostered player’s BIGAA score at their position (the replacement level player). There’s some level of debate around how many bench players** should be included in these calculations, but for now I’ll skirt the debate and just say the Big Board includes a extra players at each position based on your bench settings, such that the number of players with positive BIGz values in your final Board is equal to the number of players rostered in the league. So now we call these our BIGz scores:

* New for 2020 – I have updated my position priorities. Players are now listed at their most valuable position, in the following order (most to least valuable): C, 2B, SS, 3B, 1B, OF. SP / RP are listed at whichever role they played most often in ‘19. And the same logic is used for assigning LF/CF/RF to OF’s.
** One thing I definitely would not advise – if you’re in one of the deep leagues that has 10+ bench players… do not assume all those players are above replacement level. I would assume that 5 bench players is about the maximum that make sense to include in your calculations, for most formats.
4) Convert to $
To convert these arbitrarily-scaled BIGz scores to a more usable number, we’ll scale them to an auction budget – if you’re snake drafting, this step doesn’t matter and won’t change the overall ranks. Basically, we want to adjust such that the sum of the dollar values for all positively-valued players is equal to the total amount of $ available at the start of the draft. The $ Conversion factor is then calculated as:

And that’s basically it! The $ Conversion is applied and the BIGz score you see displayed for each player on the main page of the Big Board is a dollar value based on your chosen scoring system, league settings, etc. When you set up your Big Board, this is most of the math that is going on in the background, including finding the replacement levels, calculating the hit/pitch split modifier, and calculating the per-PA and per-IP bonuses. I hope this has all made sense – even if you don’t plan to buy the Big Board, it’d be great to know that people are using this piece as inspiration to do some player valuation work of their own. Hit me up in the comments and let me know if there’s anything I missed, anything else you’d like to know, or anything you disagree with!
Thank you so much for the write-up! I have a question about the last paragraph in the z-score section. You say "then re-z-scored vs. the AVG and STDEV of the historical number-weighted z-scores". You denote these as AVGn and STDEVn. How do you calculate those two values? What is a "historical number-weighted z-score"? Thanks again!
Hey Eric,
Those are calculated using the "z-score_n" formula showed in the post. (‘n’ standing for number-weighted)
When I say historical number-weighted z-scores, I mean that for previous seasons, I have calculated the number weighted z-scores of those stats, and calculated the AVG and STDEV values for the purposes of these formulas. Hope that helps!
Appreciate thhis blog post