The player value series is back again! I run this series of posts every year now. They are a mix of repeats from previous years, which are intended as a resource to help broaden the base of people that know how to run player values, and newly updated entries which provide info specific to 2018. Stay tuned throughout the preseason for the rest of the series! – HWB
Player rankings can seem mysterious at times. Auction values, even more so. How do your favorite fantasy baseball sites come up with these things? From ESPN to Yahoo to CBS, it’s tempting to think they’re totally arbitrary, just players and numbers thrown on a board at the author’s whim. As it turns out, there are actually several player valuation systems that are commonly used to come up with player rank – these calculations, combined with your projection system of choice, allow you to directly calculate player values and rankings!
I throw around the terms “z-score”, “SGP”, and “Points” fairly liberally here on the Harper Wallbanger blog. Fantasy baseball loves its jargon. All of these terms describe systems used to assign player values when generating rankings or auction prices. But if you’re not a hardcore spreadsheet wizard, you might be wondering what the differences actually are in how these are calculated. Especially given that the Big Board allows you to choose any of the three systems, it’s time to bring some clarity to this situation! Today is part one of the 2018 Big Board Player Valuation Series: “Where do player values come from?”
A technical note before we start: the “BIGz” score used in the Big Board was originally just a z-score, hence the “z”. These days, it’s a catch-all term used for any of the $ values generated by the sheet, no matter the valuation system used.
There are four basic steps to the creation of BIGz $ values for players from raw projections that I’ll step through and explain:
(1) Initial calculations (different for each system)
(2) Modifications (h/p split, aging, bonus PT)
(3) Replacement levels (positional adjustments)
(4) Dollar conversion
1) Initial Calculations
z-Scores
z-Score: a statistical measurement of a score’s relationship to the mean in a group of scores. A z-score can be positive or negative, indicating whether it is above or below the mean and by how many standard deviations. A z-score of 0 means the score is the same as the mean, while a z-score of 1 means the score is exactly 1 standard deviation above the mean.
z-Scores are probably the most popular system for creating player rankings and dollar values, thanks to their relative simplicity. They’re sometimes referred to as ‘FVARz’ for Fantasy Value Above Replacement z-scores as popularized by Zach Sanders (formerly) of Fangraphs. The first step of creating player values in this system is to calculate and sum the z-scores for every player. To do that, you need to know the average and standard deviation of every given stat used in your league. I use the past three years (2015-2017) of collected stat lines from all qualified players to do this. Here are some of the values currently used in the Big Board:

I then calculate the ‘above-average’ score for every player, which I call BIGAA in the Big Board, by summing the z-scores for each category. For instance, a player projected for 20 HR has a z-score of (20-16.7)/9.8, where the average # of HR’s is 16.7 and the standard deviation is 9.8, giving us a z-score of 0.34. Note that it’s important to keep your AVG and STDEV values up to date – in a previous iteration of this blog post, 20 HR was worth a z-score of 0.47 – the relative value of HR’s has changed a lot in a couple of years!
We also have to take another step for anything that is a rate stat. To illustrate why, consider the fact that a pitcher that throws 1 inning with a 0 ERA/0 WHIP is actually less valuable than a pitcher that throws 200 innings with a 3.00 ERA/1.00 WHIP despite having better rate stats. We’ll define what I call a number-weighted z-score (subscripted ‘n’ for short), in which the first z-score is multiplied by either PA, AB, or IP (depending on what the rate is measured over), then re-z-scored vs. the AVG and STDEV of the historical number-weighted z-scores.

Standings Gained Points (“SGP”)
We’ll forego the italic dictionary definition for this one. Standings Gained Points are very intuitive if you’ve ever played in a roto league, and they do exactly what they say – for each category, you decide what marginal value of that category is necessary to move up one point in the standings and gain a point. This system has been popularized and used in enough circles that I’m unsure of the origin, but for the uninitiated I will direct you towards the excellent work of Tanner Bell at SmartFantasyBaseball and at FanGraphs. I find that outside of the more peculiar leagues, SGP and z-scores will actually give very similar player valuations most of the time.
In certain contexts, SGP is the perfect system, because you can tailor it precisely to the real values placed on the various categories in your league. Your leaguemates might chase HR and forego SB every year, and you’ll be able to account for that behavior. However, it also means that you need to have good intel on your league – if it’s your first year in the league, or if there are lots of new owners, or new rule changes, then you’re SoL! The Big Board comes pre-loaded with SGP values for fairly typical 5×5 leagues:

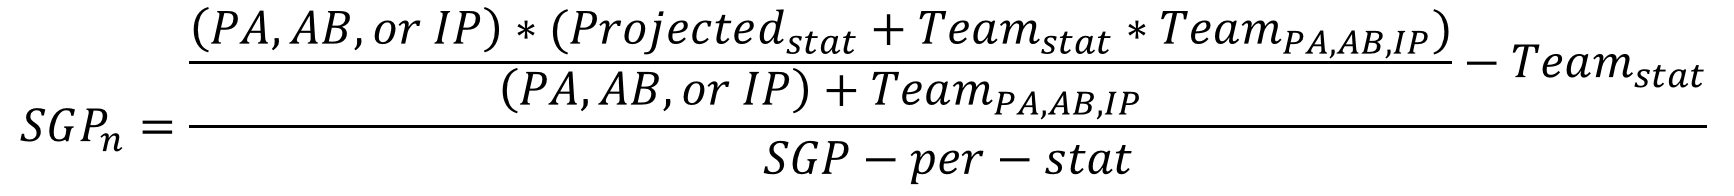
Like before, the next step is calculating the ‘above-average’ score for every player, by summing the SGPs for each category. For instance, a player projected for 20 HR has 20/10.4 = 1.92 SGPs in the HR category. Also like before, rate stats are more complicated. The approach is a bit different. Now what we’ll do is calculate your team’s overall performance in a rate stat with the given player included, then subtract the rest of the team’s performance to find the marginal difference, finally divided that value by the SGP-gained-per-stat to arrive at our SGP. That confusing explanation culminates in the confusing equation shown below, but again I will direct you to Tanner Bell’s excellent explanations here.
Points
Points are easy! Why is there even a section about points? Well, put simply, the base level calculations for points are what you would expect. Your league rules dictate each counting category is worth some number of points. Multiply each player’s projections according to the points values and you’ll arrive at a point total. Note that the way that points leagues calculations work means that playing time is VERY important! If you spend time doing one thing prepping for a points league draft, try to figure out how playing time will be distributed amongst your starters and reserve players, what the waiver wire will be like in the league, and whether you’ll be able to stash DL guys, and adjust your projections accordingly!
2) Modifications
Having calculated the raw BIGAA score for each system, things now start to get more complicated as we fine tune the values by applying a hitter/pitcher split, aging modifications, and playing time bonuses. As explained elsewhere on this site, the hit/pitch split is used to set the overall value of hitters vs. pitchers. This modification is applied as a multiplier to all pitchers until the ratio of overall hitter-to-pitcher value matches the desired ratio. The aging curve modifications are derived from the methodology introduced here two years ago. The playing time bonus allows us to account for part-time players by assuming we will fill their spot with waiver/bench-player production on days they don’t play. How to calculate the per-PA and per-IP bonuses is perhaps a discussion for another day, but the Big Board does it for you! So far, here’s what we have:
![ARdSFzd[1].jpg](https://images.squarespace-cdn.com/content/v1/58767fbe5016e1b7342a92fa/1485679193868-WD39IHQ4ZILPE9XOJ5Q8/ARdSFzd%5B1%5D.jpg)
3) Replacement levels
So we’ve arrived at BIGAA scores for all three systems. It’s good enough to a first approximation, but now we need to account for position. It’s fairly well known that you just can’t expect catchers and middle infielders to put up the same level of fantasy productivity as corner infielders and outfielders (although these days, the gap is closing for everyone except Catchers). To account for that, we’ll figure out how many players are rostered at each position, and then set each players value equal to how much better their BIGAA score is than the first unrostered player’s BIGAA score at their position (the replacement level player). There’s some level of debate around how many bench players should be included in these calculations, but for now I’ll skirt the debate and just say the Big Board includes a extra players at each position based on your bench settings, such that the number of players with positive BIGz values in your final Board is equal to the number of players rostered in the league. So now we call these our BIGz scores:

4) Convert to $
To convert these arbitrarily-scaled BIGz scores to a more usable number, we’ll scale them to an auction budget – even if you’re snake drafting, these won’t change the overall ranks. Basically, we want to adjust it such that the sum of the dollar values for all positively-valued players is equal to the total amount of $ available at the start of the draft. The $ Conversion factor is then calculated as:

And that’s basically it! The $ Conversion is applied and the BIGz score you see displayed for each player on the main page of the Big Board is a dollar value based on your chosen scoring system, league settings, etc. When you set up your Big Board, this is most of the math that is going on in the background, including finding the replacement levels, calculating the hit/pitch split modifier, and calculating the per-PA and per-IP bonuses. I hope this has all made sense – even if you don’t plan to buy the Big Board, it’d be great to know that people are using this piece as inspiration to do some player valuation work of their own. Hit me up in the comments and let me know if there’s anything I missed, anything else you’d like to know, or anything you disagree with!
Thanks so much for the write up. I’ve been working on building my own auction values and this is a huge help. Keep up the studly work.
When calculating the AVG and STDEV for pitchers, do you distinguish between SP and RP? Or do you just set the IP limit low enough to capture most RP?
So… you’ve come across one of the more arbitrary parts of the process! Here’s what I’ve done. Any pitcher that started 50% or more of the games they appeared in, I set the minimum at 100IP. All other pitchers had a minimum of 50 IP. That way, I was able to include (most) decent relievers, exclude the v bad starters that get >50IP but <100 IP, and include (most) decent starters.
I think your approach makes sense. I have a couple of follow up questions. When determining AVG and STDEV for Wins, would it be best to include only SP Wins? Would the same hold true for RP and Saves?
Given that we evaluate all SP’s and RP’s on the same spectrum (five categories), I leave them all to be evaluated as a single group. I haven’t done any analysis on what the results would look like if they were separated like you’re suggesting, but I would speculate the results would be the same or v similar.
Having trouble setting up the replacement value for an auction league. Any suggestions on how to tinker with them based on your league setting?
Ideally you want the following correct? (lets say 10 team league, 20 players drafted per team, 300$ budget for this example) :
– You want the $ sum of top 200 (20*10) players to equal $3000 (10*300)
is this correct or am I way off?
Hey Nick, is this a Big Board question or a general player valuation question?
Yep, that’s the correct general approach.
Big Board / Replacement level question.
How do you suggest we tinker with replacement value so that it bests matches the league settings?
(sorry if this is not the appropriate place to post this)
Ahh okay. So the Board will automatically calculate suggested replacement levels for you. What it displays is the # of players likely to be rostered at each position in your league (for example, 12 catchers in a 12 team league). You can adjust those numbers +/-1 fairly reasonably, if you want shortstops to be valued more highly, for instance, you would increase the number of shortstops. This means the ‘replacement level’ shortstop is now worse. If you have historical data for your league and you know that, for instance, your league carries more than 12 catchers usually, you can adjust your replacement levels to be closer to league history.
Lovely blog yoou have here