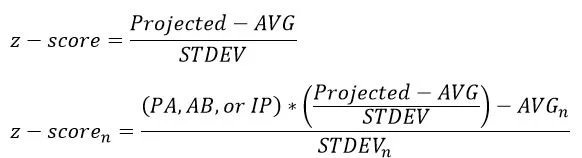
z-Score: a statistical measurement of a score’s relationship to the mean in a group of scores. A z-score of 0 means the score is the same as the mean. A z-score can also be positive or negative, indicating whether it is above or below the mean and by how many standard deviations.
After throwing around the terms z-score and BIGz somewhat haphazardly on this site, I figured the time has come to explain where it all comes from. For the math-inclined individuals among you (and you play fantasy baseball, so I’m not sure why I have to qualify that), this will hopefully satiate your need to understand where all the numbers in the Big Board come from. This is also going to theoretically empower you to create your own Big Board, but hey, save yourself some (read as: A LOT of) time and buy the one hosted on these very interweb-pages. More generally, this breaks down one of the more popular methods for creating player rankings and dollar values, sometimes referred to as ‘FVARz’ for Fantasy Value Above Replacement z-scores as popularized by Zach Sanders of Fangraphs.
The first step of creating player values in this system is to calculate and sum the z-scores for every player. To do that, you need to know the average and standard deviation of every given stat used in your league. I use the past three years (2012-2014) of collected stat lines from all qualified players to do this, and the results are displayed at the top of your HittersP/PitchersP tabs in the Big Board:

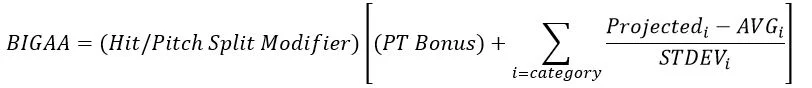
We then calculate the ‘above-average’ Big Board score for every player, termed here as BIGAA, by summing the z-scores for each category. For instance, a player projected for 20 HR has a z-score of (20-15.8)/9, where the average # of HR’s is 15.8 and the standard deviation is 9, giving us a z-score of 0.47. We also have to take another step for anything that is a rate stat. To illustrate why, consider the fact that a pitcher that throws 1 inning with a 0 ERA/0 WHIP is actually less valuable than a pitcher that throws 200 innings with a 3.00 ERA/1.00 WHIP despite having better rate stats. We’ll define what I call a number-weighted z-score (subscripted ‘n’ for short), in which the first z-score is multiplied by either PA, AB, or IP (depending on what the rate is measured over), then re-z-scored vs. the AVG and STDEV of the historical number-weighted z-scores.
Also included in the BIGAA score is the playing time bonus and the modifier for the hit/pitch split. As explained elsewhere on this site, the hit/pitch split is used to set the overall value of hitters vs. pitchers. The playing time bonus, similar to the somewhat mysteriously named ‘Experimental’ feature on the Fangraphs Auction Calculator, allows us to account for part-time players by assuming we will fill their spot with waiver/bench-player production on days they don’t play. Depending on your settings on the Big Board, you can turn this bonus off, turn it up higher, or anything in between. The default is a maximum of 100 bonus PA for hitters (up to 600 total PA) and a maximum bonus 30 IP for SP/10 IP for RP (up to 200 total IP/65 total IP). How to calculate the per-PA and per-IP bonuses is perhaps a discussion for another day, but the Big Board does it for you!
So far, here’s what we have:
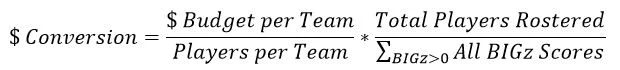
It’s good enough to a first approximation, but now we need to account for position. It’s fairly well known that you just can’t expect catchers and middle infielders to put up the same level of fantasy productivity as corner infielders and outfielders. To account for that, we’ll figure out how many players are rostered at each position, and then set each players value equal to how much better their BIGAA score is than the first unrostered player’s BIGAA score at their position. There’s some level of debate around how many bench players should be included in these calculations, but for now I’ll skirt the debate and just say the Big Board includes a couple extra players at each position based on your bench settings. To illustrate this process, here’s “replacement level” at each position for the current iteration of the Big Board using default 5×5 ESPN 12-teamer settings:
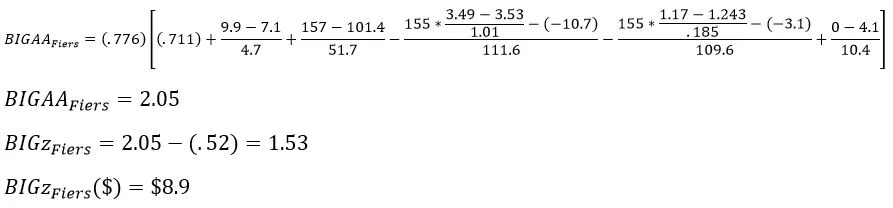
And now we call these our BIGz scores (Big Board z-scores):

To convert these to a more usable number, we’ll scale them to an auction budget – even if you’re snake drafting, these won’t change the overall ranks. Basically, we want to adjust it such that the sum of the dollar values for all positively-valued players is equal to the total amount of $ available at the start of the draft. Or, another way of thinking of it is that the average drafted player will have some z-score, and each team will spend $x per average on each player (e.g. $260 divided by 25). Net result:
But as they say – junk in, junk out! Choose your projection system wisely, and be conservative when making manual adjustments. As it is, my favorite two projection systems (Steamer and ZiPS) are included in the Big Board, and it’s hard to go wrong using either one. Another set of default tweaks to the Big Board is that we use the Fangraphs steamer plate appearance projections and Fangraphs fan projections for innings pitched. As discussed elsewhere, many projection systems are very good at rate projections, but bad at playing time projections, and even using these tweaks is never going to be highly accurate since we can’t predict injuries, coaching decisions, and trades. The steamer projections on Fangraphs use the depth charts curated by the sites authors to determine playing time for all players, including considerations for platoons, lineup position, bench players, etc. The fans tend to be better when it comes to pitchers though, as they do a better job of picking out pitchers likely to be injured, likely to lose/maintain their rotation spot, and likely to exceed 200 IP (the steamer IP never exceed 192 IP!). The fact that Kershaw pitches 230 innings every year is really valuable, and this helps capture that.
That’s it! When you set up your Big Board, this is all the math that is going on in the background, including finding the replacement levels, calculating the hit/pitch split modifier, and calculating the per-PA and per-IP bonuses. We’ll close it out with two examples.
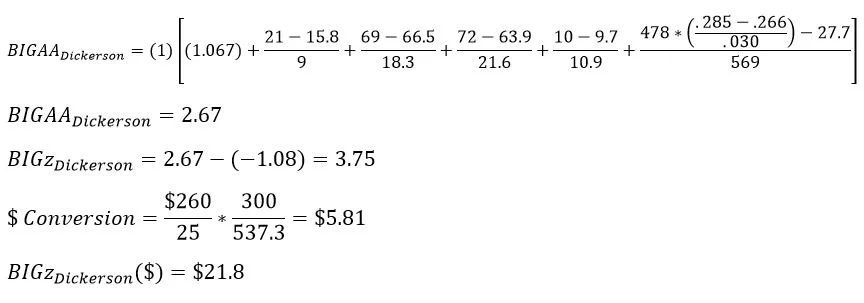
Corey Dickerson
521 projected PA – With maximum of 100 PA of bonus, up to 600 PA at most, he gets 79 PA of replacement level production: PT Bonus = .01351*79 = 1.067
Mike Fiers
155 projected IP – With maximum of 30 IP of bonus, up to 200 IP at most, he gets 30 IP of replacement level production: PT Bonus = .02369*30 = .711
[…] as originally inspired by Zach Sanders’ four-part article and further discussed by myself here. For the sake of simplicity, all discussion here is centered on 5×5 z-scores but could […]
[…] as originally inspired by Zach Sanders’ four-part article and further discussed by myself here. For the sake of simplicity, all discussion here is centered on 5×5 z-scores but could […]
So the BIGz score isn’t exactly a Auction calculator?
What do you mean? It calculates everything in terms of $ you should spend at auction.
[…] BIGz Explained Download the Big Board Big Board Tutorial Big Board Patch Notes […]
I got this web page from my buddy who shared with me aboutthis site and at the moment this time I am visiting this web page and reading very informative content here.